
Authors: Tara Gomes, David N. Juurlink, Rahim Moineddin, Piotr Gozdyra, Irfan Dhalla, J. Michael Paterson, Muhammad M. Mamdani
July 2012
Originally reported in:
Gomes T, Juurlink DN, Moineddin R, Gozdyra P, Dhalla I, Paterson JM, Mamdani MM. Geographical Variation in Opioid Prescribing and Opioid-Related Mortality in Ontario. Healthcare Quarterly. 2011. 14 (1); 22-24.
Sections reprinted with permission
Context:
In 2011, we reported rates of opioid prescribing and related mortality in Ontario in Healthcare Quarterly.
The map included in the original publication is replicated below with permission from the publisher, along with the County-level prescribing rates and opioid-related mortality rates that underlie the map (Table 1).
Additionally, annualized rates of opioid-related mortality between 2004 and 2006 have been generated at the level of the Public Health Unit in Table 2. There are 36 Public Health Units that administer health promotion and disease prevention programs in Ontario.
Methodological Notes:
- All rates were averaged over three years (between 2004 and 2006), and therefore represent an average annual rate over this period.
- In all analyses, rates are among people aged 15 to 64. Both crude and age/sex-standardized opioid-related mortality rates are presented.
- Due to the small number of opioid-related deaths in some areas, their corresponding mortality rate estimates are quite unstable, as evidenced by wide confidence intervals in Tables 1 and 2.
- For more details on the methods, please refer to the original publication in Healthcare Quarterly.
Please contact Tara Gomes (tara.gomes@ices.on.ca) with any questions relating to this report.
Figure: Opioid Prescription Rate and Opioid-Related Death Rates > 1 Standard Deviation above the mean in Ontario, by county, 2004-2006.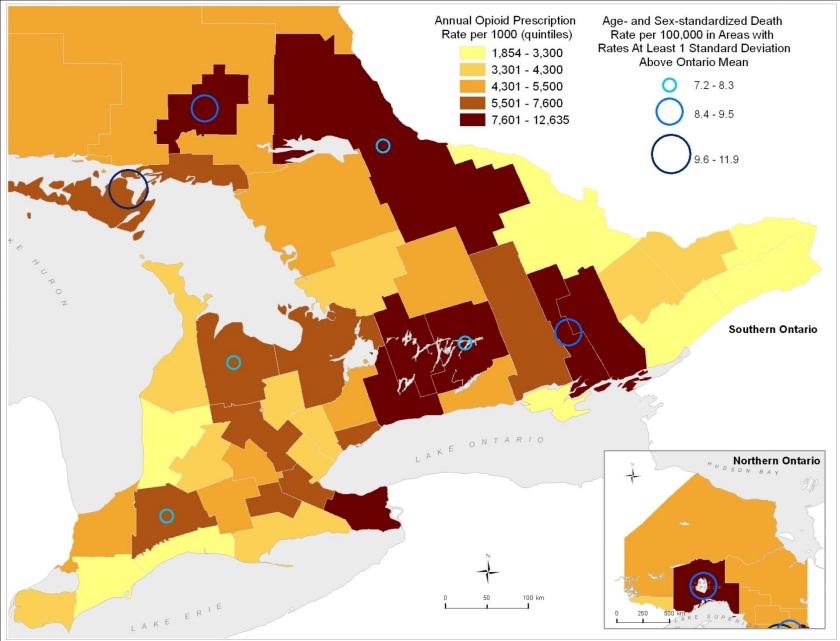
Table 1: Rates of Opioid Prescribing and Opioid-Related Deaths, by County in Ontario. Ages 15 to 64, 2004-2006.
| County | Annual Opioid Prescription Rate* | Annual Opioid-related Deaths | ||
|---|---|---|---|---|
| Crude Rate | Adjusted Rate** | 95% Confidence Interval | ||
| Algoma District | 4,995 | 5.4 | 5.3 | 2.9 to 8.9 |
| Brant County | 6,603 | 3.7 | 3.7 | 1.8 to 6.8 |
| Bruce County | 3,349 | 4.4 | 4.2 | 1.5 to 9.1 |
| Cochrane District | 4,743 | 5.1 | 5.1 | 2.4 to 9.4 |
| Dufferin County | 3,619 | 2.5 | 2.3 | 0.5 to 6.9 |
| Durham Regional Municipality | 8,622 | 3.7 | 3.8 | 2.8 to 5.1 |
| Elgin County | 3,144 | 2.2 | 2.1 | 0.6 to 5.5 |
| Essex County | 4,238 | 5.9 | 5.9 | 4.4 to 7.8 |
| Frontenac County | 10,355 | 5.8 | 6.2 | 3.7 to 9.7 |
| Grey County | 7,010 | 7.4 | 8.0 | 4.4 to 13.4 |
| Haldimand-Norfolk Regional Municipality | 3,576 | 7.1 | 7.0 | 4.1 to 11.1 |
| Haliburton County | 4,799 | 6.0 | 4.6 | 0.5 to 16.6 |
| Halton Regional Municipality | 3,645 | 2.4 | 2.5 | 1.6 to 3.7 |
| Hamilton-Wentworth Regional Municipality | 6,010 | 5.9 | 5.8 | 4.5 to 7.4 |
| Hastings County | 7,013 | 5.0 | 5.2 | 2.8 to 8.7 |
| Huron County | 2,549 | 3.3 | 3.3 | 0.9 to 8.5 |
| City of Kawartha Lakes | 8,351 | 3.3 | 3.2 | 1.0 to 7.5 |
| Kenora District | 5,233 | 3.4 | 3.3 | 1.1 to 7.8 |
| Kent County | 3,259 | 4.8 | 4.8 | 2.4 to 8.5 |
| Lambton County | 5,302 | 5.3 | 5.7 | 3.2 to 9.4 |
| Lanark County | 3,462 | 2.2 | 2.1 | 0.4 to 6.2 |
| Leeds and Grenville United Counties | 2,784 | 2.4 | 2.4 | 0.8 to 5.7 |
| Lennox and Addington County | 9,384 | 8.2 | 8.5 | 3.4 to 17.5 |
| Manitoulin District | 5,502 | 10.8 | 11.9 | 2.4 to 34.8 |
| Middlesex County | 7,399 | 7.3 | 7.2 | 5.6 to 9.2 |
| Muskoka District Municipality | 4,256 | 5.0 | 4.9 | 1.8 to 10.6 |
| Niagara Regional Municipality | 9,120 | 6.0 | 5.9 | 4.5 to 7.7 |
| Nipissing District | 8,666 | 7.9 | 8.2 | 4.6 to 13.6 |
| Northumberland County | 5,066 | 3.0 | 2.9 | 0.9 to 6.9 |
| Ottawa-Carleton Regional Municipality | 3,813 | 2.4 | 2.3 | 1.7 to 3.1 |
| Oxford County | 5,032 | 3.7 | 3.8 | 1.6 to 7.5 |
| Parry Sound District | 4,996 | 1.1 | 1.4 | 0.0 to 7.5 |
| Peel Regional Municipality | 3,683 | 2.4 | 2.4 | 1.8 to 3.1 |
| Perth County | 4,148 | 3.2 | 3.4 | 1.1 to 7.9 |
| Peterborough County | 10,713 | 7.6 | 7.7 | 4.8 to 11.9 |
| Prescott and Russell United Counties | 1,854 | 2.2 | 2.1 | 0.6 to 5.3 |
| Prince Edward County | 3,156 | 3.8 | 3.5 | 0.4 to 12.7 |
| Rainy River District | 3,838 | 0.0 | 0.0 | 0.0 to 0.0 |
| Renfrew County | 3,265 | 5.0 | 5.0 | 2.4 to 9.1 |
| Simcoe County | 7,573 | 4.4 | 4.4 | 3.1 to 6.0 |
| Stormont, Dundas and Glengarry United Counties | 3,094 | 6.0 | 6.3 | 3.5 to 10.4 |
| Sudbury District | 4,596 | 6.2 | 6.4 | 1.3 to 19.0 |
| Sudbury Regional Municipality | 8,906 | 9.1 | 9.1 | 6.2 to 12.9 |
| Thunder Bay District | 12,635 | 9.3 | 9.3 | 6.4 to 13.2 |
| Timiskaming District | 4,422 | 5.4 | 6.2 | 1.7 to 16.1 |
| Toronto Metropolitan Municipality | 5,989 | 3.7 | 3.7 | 3.2 to 4.2 |
| Waterloo Regional Municipality | 4,923 | 2.8 | 2.7 | 1.8 to 3.9 |
| Wellington County | 7,425 | 4.1 | 4.2 | 2.5 to 6.6 |
| York Regional Municipality | 4,497 | 1.6 | 1.6 | 1.1 to 2.3 |
**Age- and Sex-adjusted, per 100,000 population. Rates averaged between 2004 and 2006
Source: Gomes T, Juurlink DN, Moineddin R, Gozdyra P, Dhalla I, Paterson JM, Mamdani MM. Geographical Variation in Opioid Prescribing and Opioid-Related Mortality in Ontario. Healthcare Quarterly. 2011. 14 (1); 22-24County
Table 2: Rates of Opioid-Related Deaths, by Public Health Unit in Ontario. All ages, 2004-2006.
| Public Health Unit | Crude Rate | Adjusted Rate* | 95% Confidence Interval |
|---|---|---|---|
| Algoma Public Health Unit | 6.2 | 6.2 | 3.4 to 10.3 |
| Brant Public Health Unit | 5.1 | 5.2 | 2.8 to 8.7 |
| City of Toronto Public Health Unit | 4.2 | 4.4 | 3.8 to 5.0 |
| Durham Public Health Unit | 3.9 | 3.9 | 2.9 to 5.3 |
| Elgin-St Thomas Public Health Unit | 2.3 | 2.3 | 0.6 to 5.8 |
| Bruce-Grey-Owen Sound Public Health Unit | 6.2 | 6.7 | 4.1 to 10.4 |
| Haldimand-Norfolk Public Health Unit | 6.7 | 7.2 | 4.0 to 11.9 |
| Haliburton-Kawartha-Pine Ridge PHU | 3.8 | 3.8 | 2.0 to 6.6 |
| Halton Public Health Unit | 2.5 | 2.6 | 1.6 to 3.9 |
| Hamilton-Wentworth Public Health Unit | 6.0 | 6.0 | 4.6 to 7.7 |
| Hastings and Prince Edward Public Health Unit | 4.7 | 4.5 | 2.5 to 7.4 |
| Huron Public Health Unit | 3.4 | 3.3 | 0.9 to 8.4 |
| Kent-Chatham Public Health Unit | 4.9 | 4.9 | 2.4 to 8.8 |
| Kingston-Frontenac-Lennox and Addington PHU | 6.6 | 6.8 | 4.5 to 10.0 |
| Lambton Public Health Unit | 5.3 | 5.7 | 3.1 to 9.7 |
| Leeds-Grenville-Lanark Public Health Unit | 2.4 | 2.4 | 1.0 to 4.7 |
| Middlesex-London Public Health Unit | 7.5 | 7.5 | 5.8 to 9.5 |
| Niagara Public Health Unit | 6.3 | 6.2 | 4.7 to 8.1 |
| North Bay Public Health Unit | 7.0 | 7.4 | 4.3 to 11.7 |
| Northwestern Public Health Unit | 3.0 | 3.0 | 1.0 to 7.1 |
| Ottawa Carleton Public Health Unit | 2.6 | 2.7 | 2.0 to 3.5 |
| Oxford Public Health Unit | 3.8 | 3.9 | 1.7 to 7.7 |
| Peel Public Health Unit | 2.6 | 2.7 | 2.1 to 3.4 |
| Perth Public Health Unit | 2.6 | 2.8 | 0.8 to 7.1 |
| Peterborough Public Health Unit | 7.7 | 7.9 | 4.9 to 12.1 |
| Porcupine Public Health Unit | 5.4 | 5.3 | 2.6 to 9.9 |
| Renfrew Public Health Unit | 4.9 | 4.9 | 2.4 to 9.1 |
| Eastern Ontario Public Health Unit | 4.5 | 4.6 | 2.7 to 7.3 |
| Simcoe Public Health Unit | 4.6 | 4.6 | 3.3 to 6.1 |
| Sudbury Public Health Unit | 9.0 | 9.1 | 6.4 to 12.6 |
| Thunder Bay Public Health Unit | 9.4 | 9.6 | 6.5 to 13.7 |
| Timiskaming Public Health Unit | 5.6 | 6.3 | 1.7 to 16.3 |
| Waterloo Public Health Unit | 3.0 | 3.0 | 2.0 to 4.2 |
| Wellington-Dufferin-Guelph Public Health Unit | 4.1 | 4.1 | 2.6 to 6.2 |
| Windsor-Essex Public Health Unit | 6.4 | 6.5 | 4.9 to 8.5 |
| York Public Health Unit | 1.8 | 1.8 | 1.2 to 2.5 |